Data Visualization Trends 2021 Are Here To Stay- Want To Know Why?
-
By Shamsher Singh Bhullar
-
25th January 2021
“There is a magic in graphs. The profile of a curve reveals in a flash a whole situation — the life history of an epidemic, a panic, or an era of prosperity. The curve informs the mind, awakens the imagination, convinces.” Henry D. Hubbard
Human eyes easily recognize colors and shapes. We can quickly identify from green to yellow, square to circle. It’s scientifically proven that pictures and visuals have more impact on readers than text. This is because it’s easier to memorize a picture than a block of text.
We live in the age of big data. Every day trillions of data are generated and stored in spreadsheets, which becomes difficult for businesses to manage. If the same data were in the visual form, it would be easier to comprehend and interpret, right?
Data visualization has become the need of the hour and is used in every field. From government to education and service industries, all rely on data visualization to present data in an elegant yet simple manner.
What Data Visualization Means For Business?
Yes, we agree visuals are easier to understand and provide a compelling argument. But, the question is how you can translate data visualization to the world of business?
-High-quality infographics are 30 X likely to be read by customers rather than plain text.
-People who follow directions with illustrations perform the job 323% better than those who follow text-only directions.
-According to the Wharton School of Business study, data visualization can shorten business meeting by 24%.
-Business intelligence with data visualization capabilities offers an ROI of $13.01 back on every dollar spent.
Importance Of Data Visualization Businesses Needs To Know.
-Visualized data occupies less space.
-By using a correct chart or display, you can create an immediate and effective impact on customers.
-Trends, charts, patterns, dashboards provide a clear understanding to readers.
-Charts and graphs aid in efficient decision making.
Data Visualization Trends That Will Matter In 2021
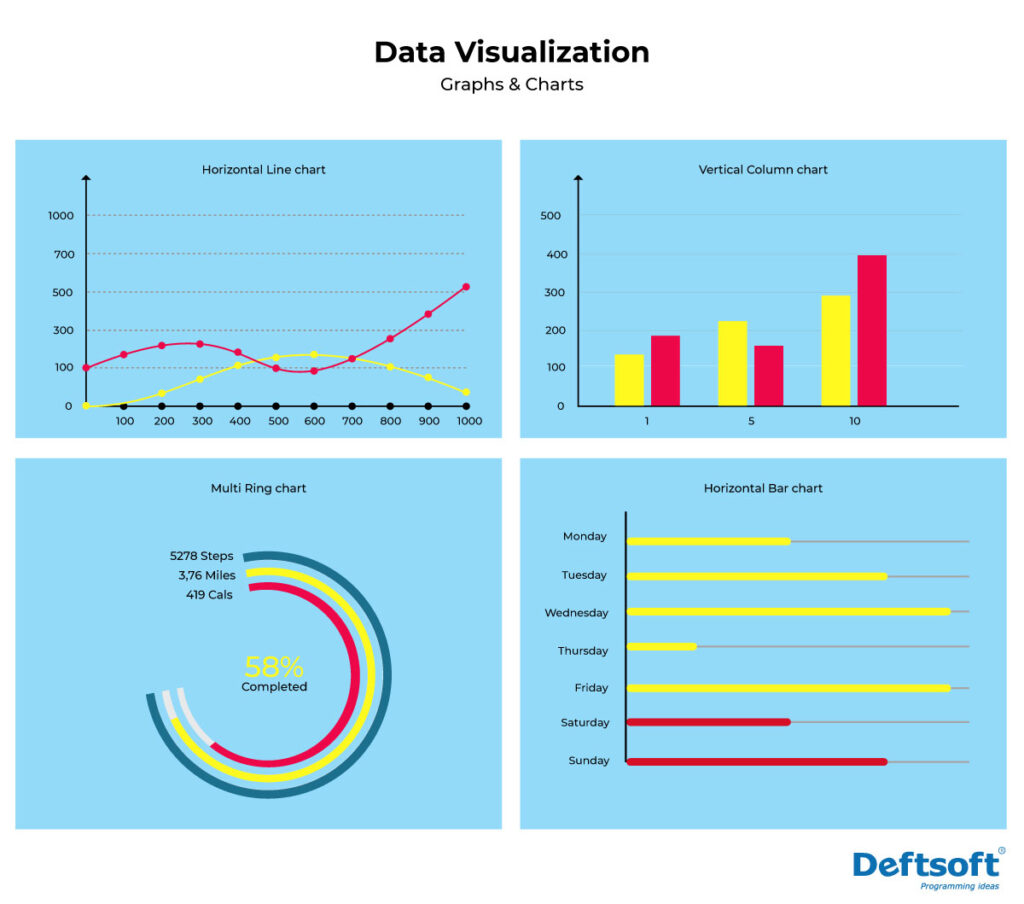
Go Beyond Graphs And Charts
Yes, graphs and charts are an integral part of data visualization services. However, in 2021, it’s time to go beyond the obvious. In addition to presenting your data in a simplified and understandable form, data visualization tools must empower you by providing meaningful insights. Data visualization includes:
– Google charts
– Search console
– Maps
A Beautiful Way To Tell A Story
Data stories are a powerful weapon for sharing data insights that influence and drive change within the organization. The backdrop of data visualization is storytelling. In 2021, designers need to communicate great experiences and convey the exact message to make the most of data visualization. This New Year creates simple stories from complex data to keep your business ahead of the curve.
Time To Become A Data Journalist
Want to present information in the form of graphs and charts that allow you to summarize details in an understandable form? If so, count on graphs and charts. Data visualization finds immense usage in the media houses for presenting trends over an extended period. Businesses can also use data visualization to concise information scattered over spreadsheets into visuals that their target audience can easily interpret.
Support For Multiple Devices
Future will be driven by mobile, but the present is a combination of multiple devices that includes desktops, tablets, mobiles and, more. If the technology you use doesn’t provide multiple device support, it’s of no use. Data visualization delivers mobile users the same experience that you offer to desktop users.
Data Visualization Will Enter The Social Domain.
Data visualization will integrate with social media to engage with a large count of followers. Data researchers have also identified this trend and are looking for ways to make data visualization more social media-friendly. The most challenging task at present is to gain the attention of the audience. And, for doing so, make sure the data is in a presentable and visually appealing form. Examples of social media visualization include:
-Google charts
-Search console
-Maps
Data Visualization Tools To Support Different Styles and Purposes
Visme
With this tool, you can go above and beyond data. The tool provides a full set of tools, a graph maker, chart templates, and a data widget library to create data visualizations of different types. With Visme, you can create data visualizations that are easy to read, understand and look stunning.
Tableau
It is the most recognized business information, visualization tool. The tool offers private data visualization and analytics for big data, corporations, and businesses. With the free tool, anyone can create data visualization. With Tableau, you can create a simple chart for creative and interactive visualizations.
Whatagraph
The data visualization tools offer data analytics for social media, PPC, SEO, and email campaigns. The visual analytics are created from a number of different integrations.
Sisense
A business intelligence tool used for creating data visualizations that provide business insights. It is mostly used for creating dashboards, but the capabilities of the tool go beyond it. With the tool, business owners can create their dashboard tailored to their needs.
With the help of data visualization tools, you can streamline your data management and ensure it’s cohesive, agile, and stable. 2021 is the right time to master the data visualization tools as the market is full of opportunities for businesses that have a working knowledge of these tools.
Recent Articles


Shamsher Singh Bhullar
 25th January 2021